Worldwide Electric Bass Market — 2026 Strategic Briefing
PW Consulting’s latest Worldwide Electric Bass Market study delivers actionable strategic intelligence for executives making capital-allocation and operational decisions in 2026. The market snapshot and scenario tools in this release are designed as a decision-enabler: they reveal the macro trajectory, competitive dimensions, and operational levers you need to stress-test investments, while reserving granular segment tables and regional distribution maps for the full report. For full datasets and interactive distribution charts, see the full report.
Worldwide Electric Bass Market
Market snapshot: what the headline numbers tell you
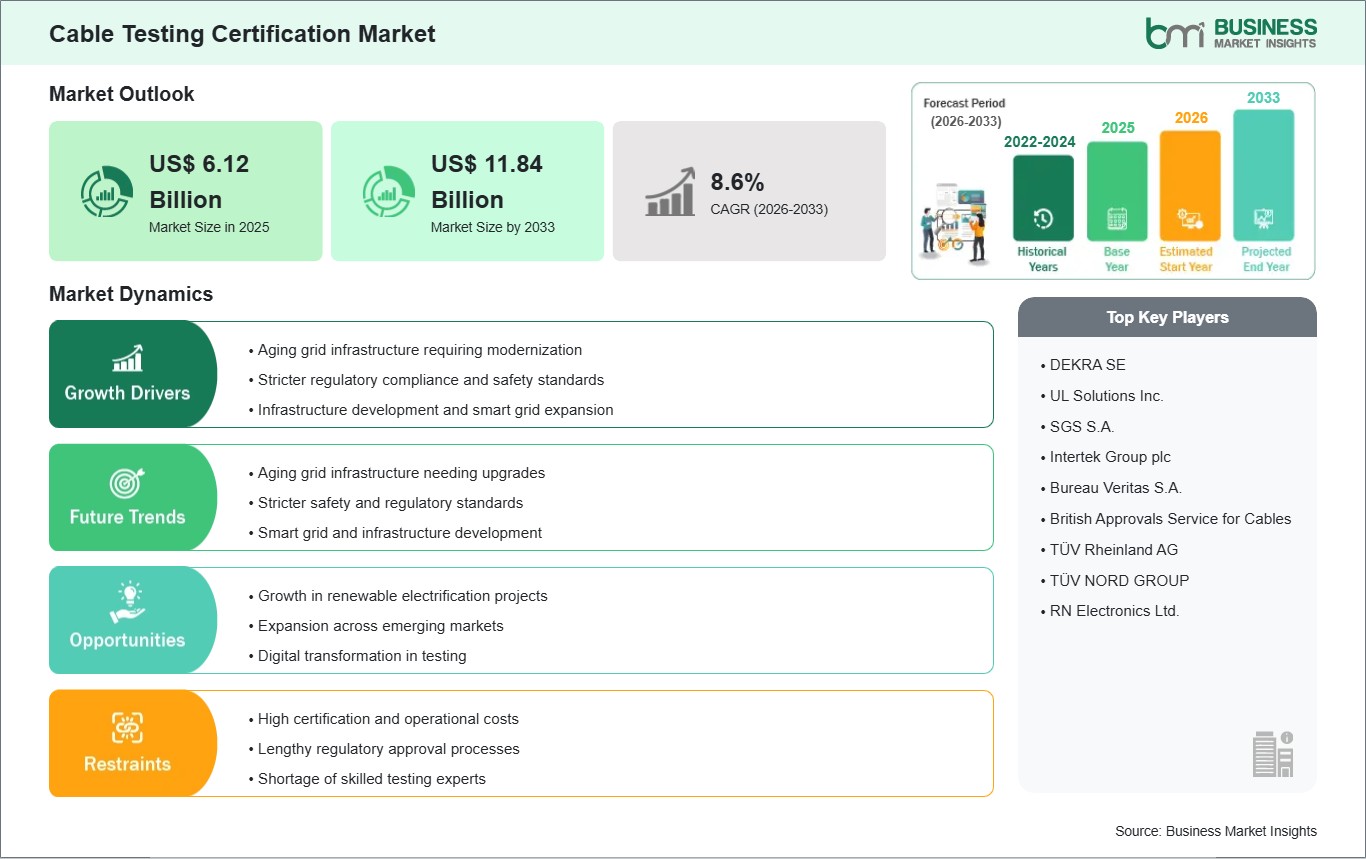
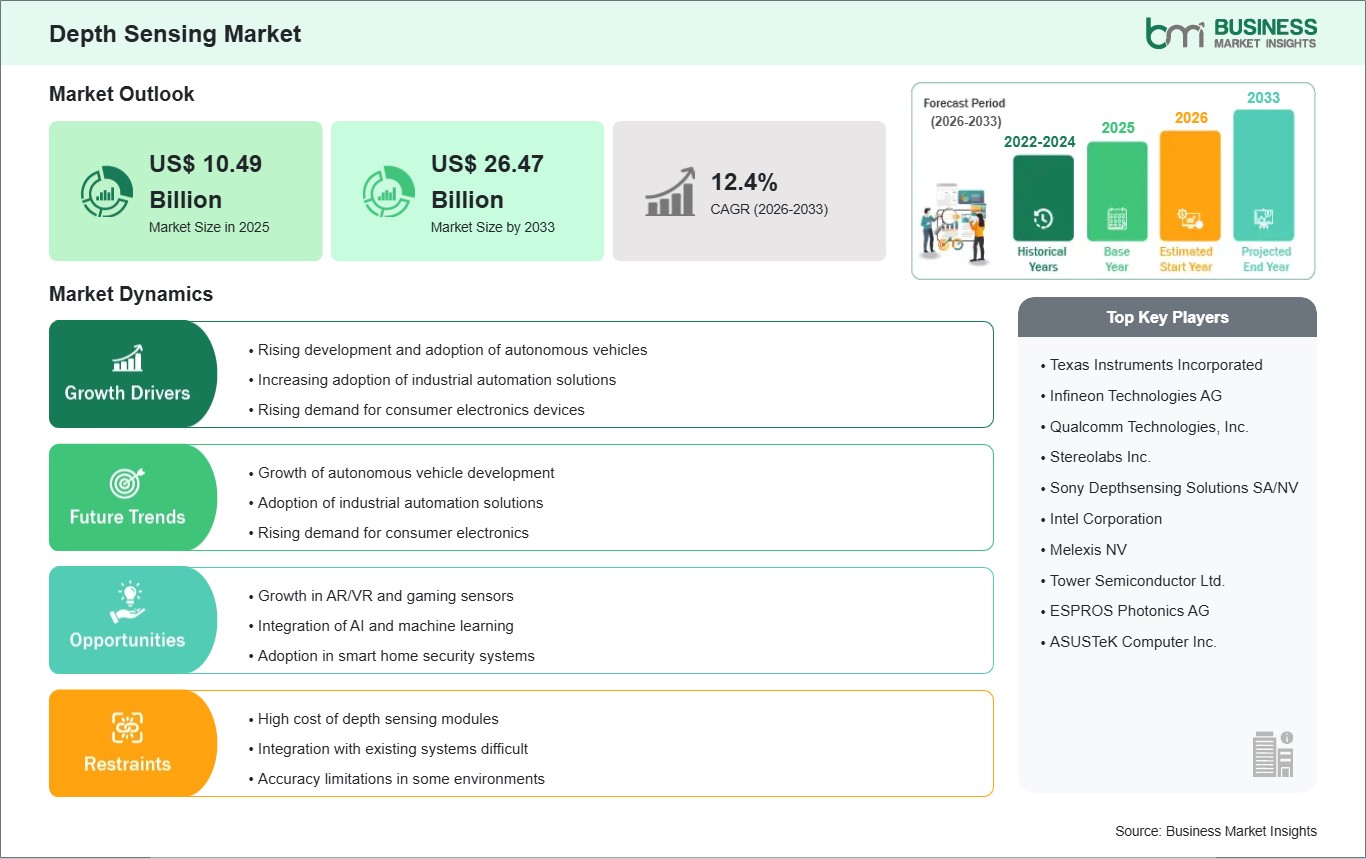
The global electric bass market is on a sustained growth path. After expanding from USD 385.1 Million in 2020 to USD 540.3 Million in 2025, the market is projected to continue growing at a compound annual growth rate (CAGR) of 6.51% through our forecast window. By 2026 the market is modeled at USD 609.6 Million, and long‑run upside places the market near USD 840.1 Million by 2032 under our base scenario.
Worldwide Electric Bass Market
These headline dynamics reflect a blended set of demand drivers (resurgent live music and streaming-driven studio activity), product-side premiumization (active electronics, multi-string models, boutique woods), and structural supply-side responses (manufacturing re‑shoring, quality-focused OEM consolidation). The aggregated growth rate conceals meaningful heterogeneity across channels and geographies — the full report contains the distribution maps and the granular breakdown you need to allocate capital with precision.
Near-term (2026) strategic implications
2026 is a pivotal year for executives who want to convert market growth into durable value. Key implications we see for boards and operational leaders include:
- Margin pressure will be asymmetric: raw material inflation and tariffs create pockets of margin compression that require targeted rather than blanket pricing responses.
- Design wins and electronics differentiation are accelerating the premium cycle; product teams that align playability, electronics architecture, and serviceability win both dealer shelf-space and studio placement.
- Supply-chain resilience is now a strategic capability: companies that can demonstrate traceable, compliant sourcing will unlock both premium pricing and lower compliance-related disruption.
- Capital allocation must be bifurcated: invest in (a) lean manufacturing/automation for cost competitiveness and (b) innovation in materials and electronics to protect product margins.
Primary macro and regulatory forces shaping 2026
The operating environment in 2026 is defined by several regulatory and input-cost realities that materially affect sourcing and product specification choices:
- Trade policy: U.S. Section 301 tariffs continue to apply a significant duty on certain instrument imports from China, altering landed-cost economics and prompting re-routing or near-shoring decisions.
- Material regulation: CITES controls on certain rosewood species are forcing players to re-spec fingerboards or establish compliant supply chains with permit trails.
- Commodity pressure: key tonewoods have experienced notable price moves due to regional restrictions, affecting BOM construction and substitution strategies.
- Labor-cost differentials: manufacturing hubs retain cost advantages but wage trajectories and local labor markets are shifting the calculus for medium-term capacity planning.
Operational tools in the report — practical, executable, confidential
PW Consulting’s deliverables emphasize operational decision support rather than academic tables. The report includes proprietary tools and templates designed to resolve 2026’s most urgent execution risks:
- Supply‑chain topology maps that show second- and third-tier supplier clustering and substitution options to reduce single‑source exposure.
- BOM teardown logic and cost-to-produce models that link material choices and electronics architectures to margin outcomes under different tariff and freight scenarios.
- Yield‑adjustment and throughput models that allow manufacturers to simulate the impact of process improvements and automation on unit economics without disclosing client-level run-rates.
- Compliance matrix and certification tracker for timber, electronics, and cross‑border trade documentation aimed at reducing audit risk and improving time-to-market.
- Technology roadmap templates that juxtapose sound-engineering advances (pickup and preamp architectures) with manufacturability and serviceability metrics used in customer design-win scoring.
Each tool is accompanied by an execution playbook showing where to apply it in sourcing decisions, product roadmaps, and M&A diligence. Parameters and sensitive scenario outputs are withheld here to preserve client confidentiality; the full set of models is available in the paid release.
Competitive landscape — dimensions that determine winners
The market is moderately concentrated: our concentration metrics show the top three firms capturing approximately 42.2% of retail value and the top five around 58.4%. These figures underscore a market where heritage brands and specialized manufacturers coexist with high-volume OEM suppliers. For 2026, competitive advantage is defined by several repeatable dimensions rather than by any single metric.
- Brand heritage and channel relationships — incumbents with deep dealer networks and artist endorsements convert brand equity into persistent pricing power.
- Manufacturing footprint flexibility — firms that combine owned capacity with vetted contract manufacturers can react faster to tariff shocks and short-term demand swings.
- Electronics and design IP — active preamps, pickup designs, and modular electronics reduce commoditization by increasing switching costs for dealers and studios.
- Material and sustainability supply chains — players that secure traceable woods and sustainable alternatives convert compliance into a commercial advantage in ESG-sensitive markets.
- Custom and boutique capabilities — small-batch, high-margin production protects margin pools even as mass-market OEMs compete on price.
Representative firms we analyzed illustrate these dimensions without divulging our confidential scenario assignments:
- Fender Musical Instruments Corporation — heritage brand strength, multi-geography production footprint, and a diversified model portfolio that supports both mass and premium tiers.
- Gibson Brands, Inc. — handcrafted, U.S.-centric premium positioning with strong vintage appeal and boutique pricing leverage.
- Hoshino Gakki (Ibanez) — product breadth and manufacturing efficiency that serve broad price bands from entry to mid-premium.
- Yamaha Corporation — engineering-driven product development and scale manufacturing across Asia, enabling product consistency and broad channel reach.
- Warwick, Ernie Ball Music Man, Rickenbacker and boutique makers — differentiated through material selection, active electronics, and bespoke craftsmanship that command price premiums.
- Cort, Peavey and other OEMs — cost leadership and capacity to supply private-label and volume segments.
These competitive vectors determine how design wins are won: a blend of time-to-market, electronics/ergonomics differentiation, dealer economics, and supply reliability — not just headline price. We map these vectors into a decision framework that helps commercial and product teams prioritize where to invest their limited 2026 budgets.
Methodology — why our findings are actionable (not speculative)
PW Consulting’s study uses layered triangulation to ensure robustness. We combine: (a) primary interviews with OEMs, suppliers and distributors under NDA; (b) structured BOM teardowns and acoustic-performance testing in our lab to link material/electronics choices to perceived value; (c) customs and shipment analytics to validate trade flows and landed-cost trends; and (d) patent and product-registration analysis to identify IP vectors and likely design win patterns. We complement these with dealer sell‑through data and studio placement logs to cross-validate demand signals.
Critically, sensitive numeric outputs (for example, company-level share forecasts and regional dollar splits) are withheld from public summaries to preserve commercial confidentiality and client privacy. The full methodology appendix in the paid report documents data sources, sampling frames, and model calibration steps in detail so you can reproduce and stress-test our scenarios during due diligence.
Recommended 2026 action roadmap
For executives preparing budgets and M&A pipelines in 2026, our research supports a pragmatic five-point roadmap:
- Prioritize supplier diversification projects where tariff exposure and single‑source materials create outsized P&L risk.
- Allocate R&D dollars to electronics and modular platform architectures that accelerate design wins while simplifying service networks.
- Invest in traceability projects for tonewoods and certifications to avoid CITES-related shipment disruptions and to access ESG premiums.
- Use BOM and yield-model scenarios to defend pricing decisions with fact‑based cost-to-serve metrics rather than intuition.
- Consider bolt-on M&A for capabilities (custom shops, electronics specialists, or localized contract manufacturers) that close strategic gaps faster than organic investment.
Next steps — where to get the full intelligence
PW Consulting’s full report contains the granular regional and application distributions, downloadable supply‑chain diagrams, company strategy dossiers, and the interactive financial models that underpin the projections summarized here. To access the detailed datasets, segmentation maps, and executable templates, visit the full report page: Access the Worldwide Electric Bass Market Research.
In 2026, the opportunity is clear but nuanced: market growth creates options, but realizing durable returns requires precise supply-chain engineering, defensible product differentiation, and compliance-ready sourcing. PW Consulting’s tools are built to convert these options into executable plans — and to help leaders decide where to commit capital now to protect optionality and accelerate profitable growth.
For detailed analysis on this topic, please visit the official page:
Worldwide Electric Bass Market
Lacy Lee
Senior Marketing Manager
sales@pmarketresearch.com
00852-95632430
PW Consulting: www.pmarketresearch.com