Worldwide Smart Water Metering Market: Strategic Briefing for Capital Allocation in 2026
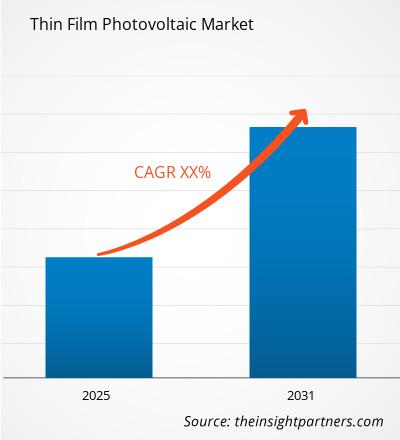
The worldwide smart water metering market is entering a decisive phase in 2026. PW Consulting’s latest market sizing places the industry at USD 4,500.0 Million in the base year 2025, with a compound annual growth rate (CAGR) of 8.5% across our 2026–2032 forecast. By 2032, the market is projected to reach USD 7,965.6 Million under our central scenario. This briefing explains why those responsible for capital allocation, product roadmaps, and regulatory compliance must treat 2026 as a window for differentiated investment.
Worldwide Smart Water Metering Market
Executive snapshot: what this means for executives
Now in 2026, utilities, original equipment manufacturers (OEMs), and systems integrators face three converging pressures: accelerating demand for digital metering endpoints; tightening trade and data-compliance regimes; and the need to compress total cost of ownership (TCO) through smarter procurement and manufacturing design. PW Consulting’s report quantifies these shifts and—critically—provides the operational tools to convert insight into executable plans without disclosing commercially sensitive segment-level allocations in this public summary.
Market dynamics driving urgency in 2026
Decision-makers must recognize the following directional forces that will determine winners and losers this decade:
- Accelerating installed base replacement and upgrade cycles: Utilities are moving from pilots to scale deployments, increasing demand for AMI-capable endpoints and associated network services.
- Shift in deployment economics: Communication infrastructure and backhaul materially influence TCO; industry benchmarks show a full AMI solution can translate into multi-hundred-dollar per-meter TCO when integration and lifecycle services are included, making procurement strategy essential.
- Regulatory and procurement constraints: Temporary exemptions (for example, Build America, Buy America waivers extending into 2027) provide short-term flexibility, but they also introduce a multi-year runway for domestic sourcing investments—and therefore manufacturing and supply-chain decisions made in 2026 will have multi-year implications.
- Technology convergence: LPWA protocols (NB-IoT, LoRaWAN), combined with improved battery chemistries and edge analytics, are redefining meter capabilities and vendor selection criteria.
- Data sovereignty and cybersecurity: Emerging laws on data residency and stricter cybersecurity expectations mean that data-handling architectures are now procurement differentiators rather than optional features.
Directional market snapshot (high-level)
Our top-line estimate—USD 4,500.0 Million in 2025 growing at 8.5% CAGR—captures the aggregate commercial opportunity. PW Consulting’s modelling includes historical deployment rates (2020–2025), observed procurement round frequency, and scenario-based adoption trajectories for 2026–2032. For full regional and application distribution maps, please consult the full report.
Report deliverables that drive 2026 action
PW Consulting’s Worldwide Smart Water Metering Market report is purpose-built to convert market insight into operational advantage. The suite of deliverables is tailored for procurement, product, and finance teams and includes:
- Supply-chain topology and risk heatmaps that identify single-sourced components and concentration risk by tier.
- Bill-of-Materials (BOM) decomposition and cost-translation logic to model how semiconductor, battery, and comm-module price movements affect per-unit economics.
- Yield-adjustment models and factory-output scenarios that translate process yield, rework rates, and component lead times into realistic delivery schedules.
- Technology roadmaps and interoperability matrices that show readiness levels for NB-IoT, LoRaWAN, and hybrid network deployments.
- Commercial scenario models (CAPEX vs OPEX trade-offs) for network-as-a-service and metering-as-a-service procurement options.
Each tool is designed to be plug-compatible with a client’s internal cost models, enabling rapid sensitivity testing without requiring public disclosure of proprietary distributional data in this brief.
Competitive landscape: dimensions that will decide 2026 design wins
The market exhibits moderate concentration: the three largest vendors account for approximately 45.0% of market revenue (CR3), while the top five account for about 60.0% (CR5). Competitive advantage in 2026 is less about unit cost alone and more about layered capabilities across the following dimensions:
- Installed base and service footprint: A large installed base creates recurring service revenues and preferential access to retrofit opportunities where utilities prefer single-vendor compatibility.
- Integration with utility IT/OT: Vendors that provide seamless head-end integration, meter data management, and analytics win where end-to-end SLAs matter.
- Manufacturing and sourcing footprint: Firms with regionally diversified production and component supply are advantaged under tightening procurement rules and BABA-style requirements.
- Metrology and reliability: Metering accuracy, longevity, and low maintenance overhead are primary selection criteria for high-value commercial and industrial customers.
- Security and data-governance controls: Proven approaches to firmware security, data residency and auditability are decisive in regulated markets.
- Commercial innovation: Flexible financing—meter-as-a-service, revenue-share models, and network subscription structures—remain key to winning budget-constrained utilities.
PW Consulting’s vendor analysis examines these dimensions for each major supplier (Itron, Xylem/Sensus, Badger Meter, Kamstrup, Diehl Metering, Neptune, Landis+Gyr, Arad Group, ZENNER, Aclara, BMETERS, Apator, Honeywell/Elster). Our profiles focus on moats and decision levers rather than prescriptive predictions, allowing clients to use the insights to prioritize partner and competitor responses. For an in-depth vendor comparison matrix, please see the full report.
Explore vendor decision levers and our comparative matrix in the full study: Access the full report.
Regulatory and infrastructure context shaping 2026 choices
Regulation, infrastructure cost, and local policy programs materially influence where and how capital is deployed:
- Build procurement conditions and waivers deliver short windows for compliance-driven sourcing; manufacturers must decide now on near-term sourcing strategies to avoid later market exclusion.
- Data sovereignty rules require architectures that can segregate and localize analytics workloads—selection of cloud/edge providers is a procurement decision with long-term lock-in implications.
- Communication choices (NB-IoT, LoRaWAN, cellular) are both technical and economic decisions; each protocol implies different lifecycle support and battery-replacement strategies that affect long-term OPEX.
- Large national programs and infrastructure funds continue to catalyze volume deployments, accelerating vendor selection cycles and creating clustered demand for end-to-end solutions.
Methodology: why our numbers and operational models are robust
PW Consulting’s conclusions rest on a layered, triangulated methodology designed to surface both visible and opaque market signals. Our approach integrates patent citation analyses, customs and shipment reconciliations, and BOM reverse-engineering from sample teardowns to map component-level cost drivers. We combine these inputs with multi-stakeholder interviews (utilities, system integrators, meter OEMs, and procurement authorities), RFP and contract analysis, and reconciliations against vendor-reported installed-base disclosures.
To enhance precision, we apply a Layered Triangulation framework: cross-validating macro deployments (utility program disclosures) against micro evidence (teardown BOMs and factory yield models) and commercial signaling (tender awards and supply agreements). We also incorporate anonymized procurement datasets and confidential operator interviews under NDA to inform realistic adoption curves and vendor share estimates. This methodology produces practical outputs—supply risk maps, BOM cost-translation logic, and realistic delivery schedules—that are directly actionable for 2026 planning.
Strategic implications and recommended actions for 2026
Based on PW Consulting’s analysis, organizations should prioritize three strategic objectives this year:
- Lock in compliant supply chains: Given procurement rule uncertainty and the short runway to compliance changes, firms must evaluate domestic sourcing and second-source strategies for critical electronics now.
- Preserve margin via BOM and yield optimization: Use BOM decomposition and yield models to stress-test supplier negotiations, outsourcing scenarios, and product redesigns that target the largest cost levers without degrading metrology performance.
- Differentiate through services and data governance: Build offerings that combine robust metrology with transparent data-governance and flexible commercial models (e.g., NaaS/MaaS) to win utility design cycles and long-term service contracts.
These actions are time-sensitive: capital and strategic choices made in 2026 will influence competitive position and margin structure throughout the forecast period to 2032.
Next steps
PW Consulting’s full Worldwide Smart Water Metering Market report contains the detailed regional, technology and application splits, the full vendor benchmarking matrix, and downloadable operational models that clients can license and adapt. To obtain the comprehensive dataset, regional distribution maps, and the executable toolset, please visit our report page: Read the full report.
For detailed analysis on this topic, please visit the official page:
Worldwide Smart Water Metering Market
Lacy Lee
Senior Marketing Manager
sales@pmarketresearch.com
00852-95632430
PW Consulting: www.pmarketresearch.com
Latest Post