Worldwide MOSFET Gate Driver Market — Strategic Briefing for 2026 Capital Decisions
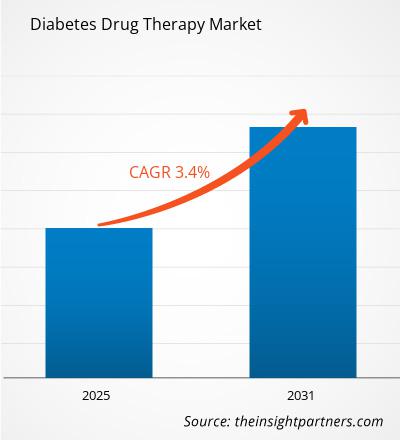
In 2026, the MOSFET gate driver market sits at a strategic inflection point for system OEMs, power semiconductor suppliers and investors. PW Consulting’s new Worldwide MOSFET Gate Driver Market report grounds executive decision-making in a single, actionable narrative: the market is expanding at a sustained pace driven by system electrification, wide‑bandgap adoption and supply‑chain realignment. Our market model shows the industry growing from an estimated USD 2,280.0 Million in 2025 to approximately USD 2,524.6 Million in 2026, and projecting to USD 3,710.0 Million by 2032 at a 7.2% CAGR over the forecast window (2026–2032). This briefing explains why that growth matters for 2026 capital allocations, which practical tools the report delivers, and how incumbent and challenger vendors are competing along the value chain.
Worldwide MOSFET Gate Driver Market
Market Snapshot — What CFOs and Heads of Product Need to Know
The macro picture is straightforward but consequential: steady demand for gate drivers is being amplified by three intersecting vectors—electrification of transport and industrial systems, acceleration of GaN/SiC device penetration, and system‑level efficiency requirements that push smarter gate control and integrated protection. Market concentration is moderate: the top three suppliers account for approximately 42.5% of revenue and the top five for about 58.2%, indicating both entrenched incumbents and meaningful room for differentiated entrants to capture design wins.
- Structural growth drivers: growth is driven by higher-voltage, higher-efficiency power conversion applications and by reference‑design adoption in OEM supply chains.
- System pressure points in 2026: raw material inflation (notably gallium), regional trade frictions, and evolving export controls make supplier continuity and cost decomposition central to near‑term risk management.
- Why timing matters: given the industry’s 7.2% CAGR, delaying supplier qualification or design‑win investments in 2026 will raise switching costs and reduce optionality in 2027–2028.
Regulatory and Supply‑Chain Context
2026 presents new operational constraints that materially affect capital planning and sourcing strategies:
- Trade measures: a 25% ad valorem tariff on certain advanced semiconductors implemented in January 2026 and tightened export‑license reviews create near‑term cost and compliance impacts for cross‑border procurement.
- Material shocks: semiconductor material costs, including gallium, have roughly doubled for some inputs over the last 12 months, prompting redesign and BSM (bill of materials) sensitivity analyses.
- Geopolitical realignment: export controls and equipment restrictions are accelerating regionalization of mature-node supply while market demand for wide‑bandgap devices continues globally.
Practical Tools in the Report — How PW Consulting Converts Insight into Action
To translate market trends into executable programs for 2026, the report includes a suite of practical, deployable tools that go beyond high‑level forecasting:
- Supply‑chain topology maps that identify single points of failure and alternate routing strategies for critical components.
- BOM decomposition logic that links component cost drivers to assembly and test steps, enabling targeted cost reduction initiatives without compromising safety margins.
- Yield‑adjustment and sensitivity models that quantify margin exposure under different wafer yields, package yields and yield ramp scenarios.
- Technology roadmaps that correlate gate‑driver functionality (isolation, active Miller clamp, high‑side integration) with downstream system benefits and qualification timelines.
These instruments are designed to be implemented by product, procurement and finance teams: for example, procurement can prioritize dual‑sourcing paths flagged by the supply‑chain map, while engineering can use BOM decomposition to identify the first order feature tradeoffs—e.g., active Miller clamp versus added component count—that deliver the most durable cost‑in‑use reductions in 2026. The report deliberately avoids prescribing a single “optimal” configuration; instead, it gives the analytical means to evaluate tradeoffs under your own product constraints and compliance requirements.
Competitive Landscape — Dimensions that Decide Design Wins
The gate‑driver battleground in 2026 is organized around a set of repeatable competitive dimensions. PW Consulting’s vendor analysis synthesizes public disclosures, primary interviews and proprietary tear‑down data to map where incumbents hold durable advantages and where challengers can pivot.
- Reference‑design ecosystems and software support: vendors that provide tested reference designs, evaluation kits and simulation models reduce OEM integration time and materially increase design‑win probability.
- Device compatibility and IP breadth: support for Si, SiC and GaN across product portfolios, and patents around isolation and Miller‑clamp topologies, create differentiated barriers to entry.
- Qualification and reliability track record: automotive ASIL/ISO and industrial thermal lifecycle data shift procurement toward vendors with demonstrated qualification pipelines.
- Supply continuity and manufacturing partnerships: firms with diversified packaging sources and local manufacturing footprints are better positioned to manage tariffs and export reviews.
- Cost‑to‑system and distribution depth: price and logistics matter for high‑volume consumer and industrial segments; strong distribution partners accelerate market penetration.
Across the vendor set we profile—ranging from global majors to specialized suppliers—PW Consulting highlights each company’s competence in these dimensions rather than predicting exact 2026 market shares. Examples of notable recent moves include Microchip Technology’s January 2026 launch of a 600V gate‑driver family tailored to high‑voltage motor control, Toshiba’s 2025 SiC‑focused photocoupler with active Miller clamp, and Shindengen’s 2025 high‑side Nch‑MOSFET driver designed for reverse‑connection protection. These developments illustrate how product roadmaps and protection features are becoming decisive factors in next‑generation design wins.
For a detailed vendor map that juxtaposes technology capabilities, ecosystem assets and supply‑chain reach, consult the full vendor profiles and comparative matrices in the report: Read the full report.
Methodology — Why Our Findings Are Actionable
PW Consulting’s analysis rests on layered triangulation and reproducible, multi‑source validation. Our approach synthesizes three pillars: (1) quantitative bottom‑up modeling from BOM and teardown analyses, (2) patent citation and IP landscape mapping to infer technology trajectories, and (3) qualitative primary research including anonymized interviews with OEM design leads, tier‑1 suppliers and manufacturing partners. We calibrate yield and cost models to public financials and to anonymized supplier submissions, then stress‑test scenarios against trade and materials shocks to generate actionable probability distributions rather than single‑point forecasts.
Critically, several inputs in our model are derived from validated non‑public sources—anonymized purchase order timelines, supplier qualification dossiers and lab‑level yield logs—collected under confidentiality agreements. This allows us to identify early shifts in supply‑chain commitments and design‑win momentum that are not visible in public filings. The net result: a defensible forward view that supports investment decisions under regulatory and material volatility conditions prevalent in 2026.
Strategic Implications and Tactical Guidance for 2026
Based on our synthesis, executives should prioritize three actions in 2026:
- Accelerate qualification of at least one alternate supplier for critical gate‑driver components, focusing on vendors with regional manufacturing or distribution that mitigate tariff and export‑control exposure.
- Prioritize design features that reduce system cost‑in‑use—such as integrated active Miller clamp or self‑powered isolation—only after BOM sensitivity analysis confirms net lifecycle benefit.
- Embed supply‑chain analytics in quarterly capital reviews: use yield‑adjustment scenarios and BOM decomposition to stress test projected ROIC under material‑cost and tariff shocks.
These are not prescriptive engineering specs; they are programmatic priorities informed by our modeling and by observed procurement behavior across OEMs in 2025–2026.
Why Now — The Case for Immediate Capital Allocation
Two dynamics make 2026 a decisive year for capital allocation: rising replacement costs for delayed design wins as incumbents lock down reference ecosystems, and the asymmetric downside from supply disruptions given higher component cost volatility. With a mid‑single‑digit CAGR that compounds over multiple product cycles, early investments in supplier diversification, qualification labs and in‑house BOM analytics pay out through reduced time‑to‑market and lower margin erosion under stress scenarios.
To explore the full dataset, detailed regional and application splits, scenario outputs and the actionable playbooks referenced here, access the complete report at: Read the full report.
Contact
PW Consulting’s Power Electronics practice is available for bespoke briefings and rapid‑turn supplier benchmarking projects tailored to 2026 procurement cycles. For advisory engagements based on the report’s tools, please refer to the report link above.
For detailed analysis on this topic, please visit the official page:
Worldwide MOSFET Gate Driver Market
Lacy Lee
Senior Marketing Manager
sales@pmarketresearch.com
00852-95632430
PW Consulting: www.pmarketresearch.com