Guar Market 2026: Strategic Imperatives from PW Consulting’s New Industry Brief
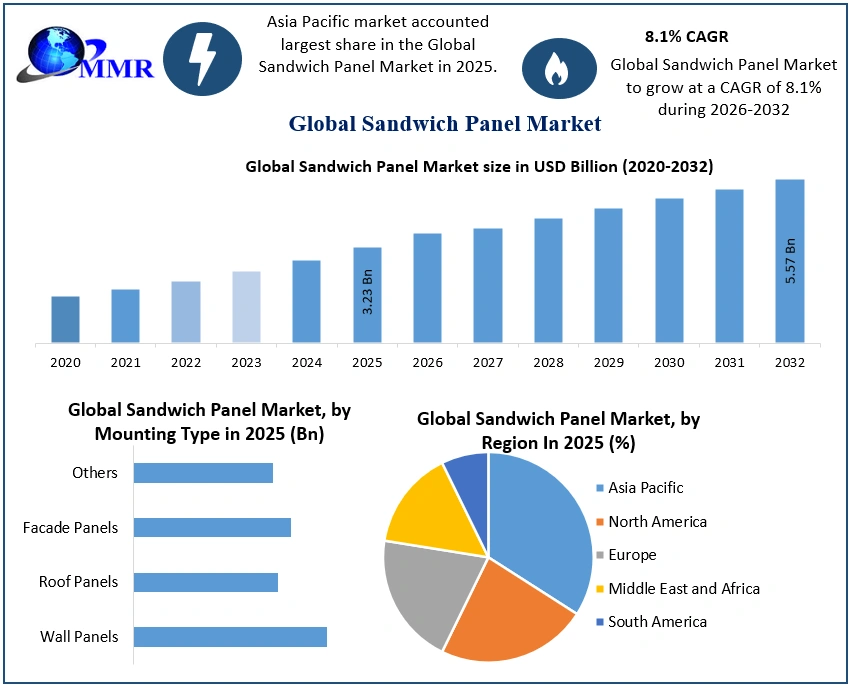
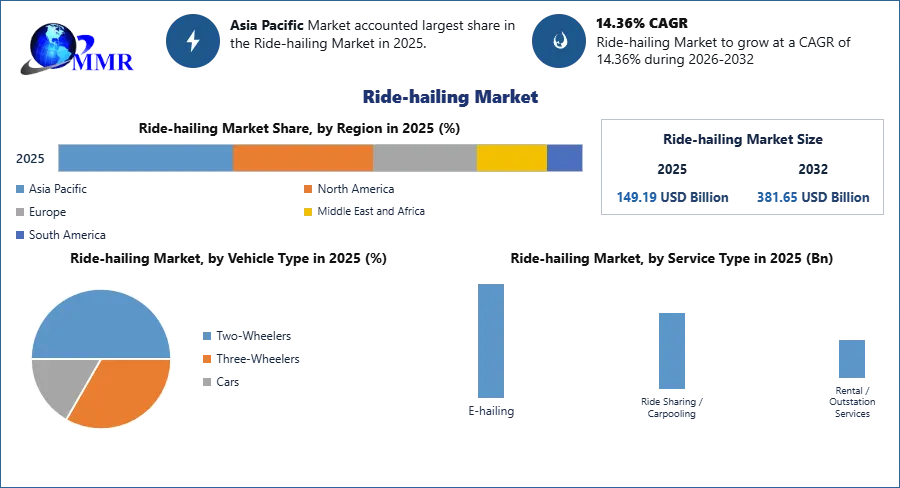
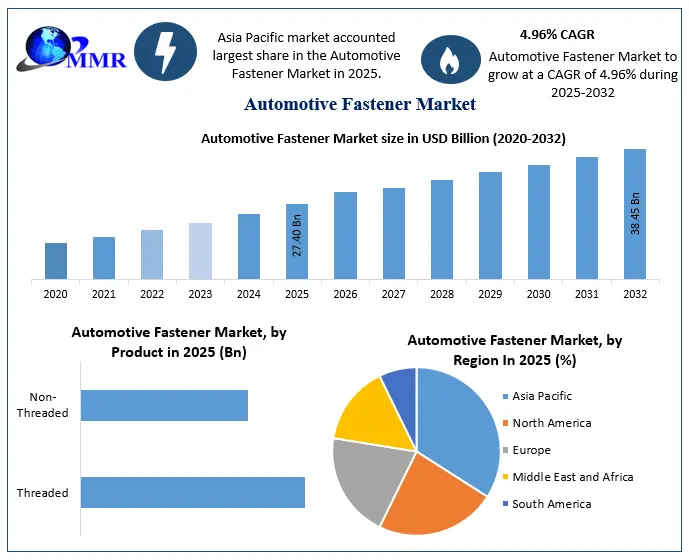
In 2026 the guar market is at an inflection point. PW Consulting’s latest Guar Market report — base year 2025, historical window 2020–2025, forecast period 2026–2032 — synthesizes primary fieldwork, proprietary trade analytics and multilayered triangulation to convert commodity volatility into actionable strategy. Our headline macro finding: the global guar market expands from an assessed 1,318.0 USD Million in 2025 toward a materially larger market by 2032 at a compound annual growth rate (CAGR) of 5.3% (2026–2032). This trajectory is sufficient to alter capital allocation priorities across procurement, manufacturing and product development in 2026.
Guar Market
Why 2026 Is a Decision Year
Several structural drivers make 2026 the year for decisive action:
- Supply-side concentration and production cycles that amplify price and availability risk for processors and end-users.
- Stronger regulatory scrutiny and clean-label demand across major consumption markets, forcing suppliers to accelerate traceability and certification investments.
- Industrial users (notably oilfield and technical applications) demanding performance consistency as digitalized process controls tighten tolerances on rheology modifiers.
These forces combine to create both risk and opportunity — firms that act in 2026 to shore up supply resilience, secure quality design-wins and migrate to compliant formulations will capture outsized margin benefit across the forecast period.
Market Shape and Concentration
Our assessment shows an expanding market size with year-on-year growth from 2020 to 2025 and a steady projected expansion through 2032 (market value progression: 2020 = 1,045.5; 2025 = 1,318.0; 2032 = 1,885.7 USD Million, rounded to one decimal). Competitive intensity is moderate: the top three firms account for roughly 42.5% of the market and the top five approach 58.8% — a structure that enables regional champions to exert pricing discipline while leaving room for niche specialists.
Supply Base Realities (What Buyers Need to Know)
Raw-material dynamics are the single biggest determinant of near-term cost and availability. India continues to be the dominant origin for guar seed and processed derivatives, underpinning the majority of global capacity.
- Geographic concentration of production makes harvest cycles, weather and domestic procurement policy central to international price formation.
- Export logistics and customs regimes create actionable windows where long-term contracts reduce “spot” exposure but introduce rollover risk if harvests disappoint.
- For corporate procurement, the balance shifts in 2026 toward blended supplier portfolios (local buffer inventory + long-term origin agreements) and stricter vendor scorecards emphasizing traceability and certifiable processing.
Operational Playbook Embedded in the Report
PW Consulting’s Guar Market report is designed as an operational toolkit for 2026 decision-makers. It does not stop at high-level forecasts; the deliverable contains analytically rigorous, practitioner-oriented modules that support immediate implementation:
- Supply-chain maps that trace origin-to-end-user flows, highlighting single-source nodes, cross-border choke points and storage constraints.
- BOM (Bill of Materials) decomposition logic that isolates guar’s contribution to finished-goods cost and quality variability, allowing procurement to run sensitivity scenarios without exposing supplier-level prices in public summaries.
- Yield-adjustment and conversion models that translate seed-harvest variability into finished-product output, enabling manufacturing planners to size safety stock and adjust run rates.
- Technology roadmaps that map derivative process upgrades (e.g., improved milling, fractionation and functionalization techniques) against expected capex timelines and ROI windows.
- Regulatory & compliance matrices aligned to major markets (food safety, dietary-fiber classification, export controls), integrated with a supplier audit checklist for 2026 procurement cycles.
Each tool is built to be plug-and-play for teams optimizing cost to serve, reformulation timelines or compliance remediation plans during 2026 procurement rounds.
How These Tools Solve 2026 Pain Points
- Cost control: BOM decomposition and yield-adjustment models let procurement quantify the impact of origin volatility on finished product margins and test hedging or blended sourcing strategies before contract execution.
- Compliance and certification: the regulatory matrix prioritizes certification pathways (e.g., food-safety, clean-label) by market, reducing the time and capital wasted on low-impact accreditations.
- Manufacturing reliability: technology roadmaps and supplier scorecards identify where modest capex (improved milling, QC automation) eliminates the most frequent quality complaints that trigger costly rework.
- Contract negotiation: supply-chain mapping exposes single-source nodes and creates leverage for buyers to design fallback supply arrangements or indexed pricing clauses that are auditable and enforceable.
Competitive Landscape — Dimensions that Matter
Our competitive analysis focuses on the structural dimensions that will determine winners in 2026, rather than enumerating firm-specific forecasts. Core competitive vectors include:
- Origin control and upstream integration — firms with tight linkages to seed procurement or with backward-integrated processing have a defensible cost and quality position.
- Certifications and quality systems — FSSC 22000, ISO, organic and pharmaceutical-grade controls are design-win enablers for food and pharma customers where traceability is non-negotiable.
- Logistics footprint and distribution networks — proximity to major demand centers and ability to provide just-in-time shipments mitigates storage costs for high-value users.
- Technical application capability — suppliers that invest in application labs and co-development can convert initial trials into specification-level wins, especially in food-stabilization and oilfield polymers.
- Brand and contract performance — long-tenured suppliers with a track record of delivery during harvest-cycle stress demonstrate the operational leash customers value.
Companies operating in the sector — from large global ingredient suppliers to specialized Indian processors and U.S. technical distributors — differentiate along these vectors. Design wins in 2026 will hinge on proof points: demonstrable traceability, consistent particle-size distribution, supply-resilience clauses and aligned certification footprints.
Recent corporate actions — such as timely market updates from distributors and corporate positioning by long-established suppliers — reinforce that information asymmetry is narrowing. PW Consulting’s report surfaces the competitive levers buyers and investors should monitor in 2026 to identify sustainable winners.
Access the full Guar Market report for detailed competitive matrices, supplier scorecards and the full distribution maps that underpin our strategic recommendations.
Industry Dynamics and Short-Term Signals
Key 2026 signals that informed our scenario workstreams include harvest completion estimates, short-term price moves and evolving regulatory confirmations. These operate as near-real-time stress tests for corporate hedging strategies and capex prioritization.
- Harvest and production estimates remain the immediate supply signal; weather and sowing patterns can shift realized output within a narrow window post-harvest.
- Price spikes and rapid reversals observed in early 2026 underline the need for contractual flexibility — fixed-term contracts reduce spot exposure but require embedded indexation or material adverse clauses.
- Regulatory clarity in major consuming markets affirms guar gum’s accepted food-status, tightening the window for compliant reformulations and creating opportunities for premiumisation in clean-label segments.
Methodology: Why Our Findings Are Actionable
PW Consulting’s approach combines traditional market research with forensics and active field intelligence. Two methodological pillars merit highlighting:
Layered Triangulation. We synthesize three independent evidence streams — customs and trade flows, plant-level audits and proprietary buyer-supplier interviews — then cross-validate against satellite-assisted crop monitoring and industry cash-price scraping. This reduces single-source bias and reveals actionable lead indicators of supply stress before they appear in public prices.
Patent and Application Citations. For technology-path analysis we mapped process patents, formulation filings and application notes to supplier capability claims. Patent-application concordance allows us to infer which process upgrades are early-adopted versus aspirational, and to estimate the realistic time-to-scale for improved functional grades.
Strategic Recommendations for 2026 (High-Level)
Based on our scenario modeling, executives should prioritize three moves in 2026:
- Execute a two-tiered sourcing strategy: secure a firm proportion via forward commitments and keep a tactical spot allocation to capture short-term price dislocations.
- Accelerate supplier qualification for food/pharma-grade supply chains, focusing on traceability and lab-based verification that support rapid design-wins.
- Invest selectively in processing upgrades and QC automation that produce the highest ROI in reducing rework and enabling premium product positioning.
Each recommendation is accompanied in the full report by implementation checklists, scenario P&L stress tests and sample contract language designed for 2026 negotiations.
Next Steps and How to Obtain the Full Analysis
PW Consulting’s Guar Market report is intentionally gated: the public brief above demonstrates our framing and analytic depth while preserving the detailed segmentation, regional distribution maps and supplier-specific scoring that are core to operational execution.
For teams planning capital allocation, procurement strategy or M&A diligence in 2026, the report provides the empirical foundation — supply-chain schematics, BOM models, yield-adjustment logic and technology timelines — needed to move from strategic intent to executed outcomes. Download the complete dossier and interactive datasets here: https://pmarketresearch.com/chemi/guar-market.
For detailed analysis on this topic, please visit the official page:
Guar Market
Lacy Lee
Senior Marketing Manager
sales@pmarketresearch.com
00852-95632430
PW Consulting: www.pmarketresearch.com