Flip‑Flop IC Market 2026: Strategic Intelligence Briefing for Capital Allocation
PW Consulting publishes a focused industry briefing on the Flip‑Flop IC market in 2026 to guide executive decision‑making on investment timing, supply‑chain reshaping and product roadmap prioritization. This article highlights the report’s strategic value, synthesizes the macro economic and regulatory context of 2026, and previews the research instruments that will materially reduce execution risk for buyers, OEMs and component suppliers. Detailed segment breakdowns and proprietary tables are intentionally withheld to encourage direct access to the full dataset.
Flip Flop IC Market
Market snapshot — macro numbers you need to budget around
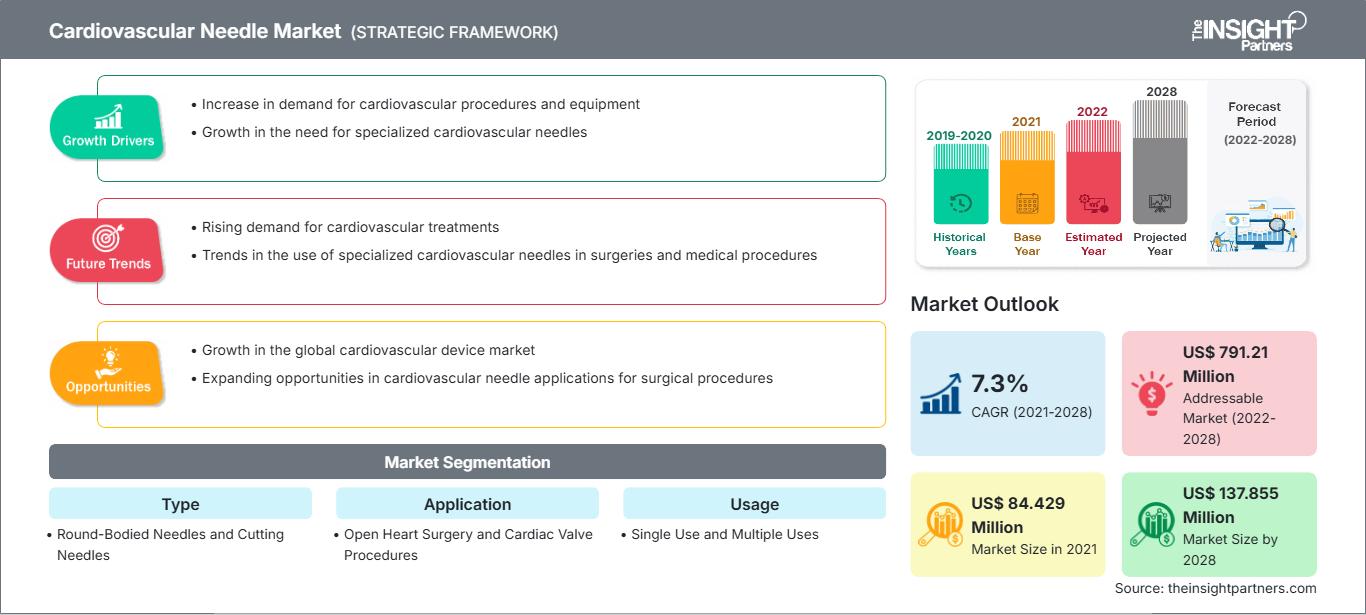
The flip‑flop integrated circuit market has moved from USD 710.0 Million in 2020 to USD 906.0 Million in the base year 2025, driven by an expanded addressable base across consumer, automotive and industrial systems. PW Consulting’s forecast period runs 2026–2032 and assumes a compound annual growth rate (CAGR) of 5.3% (5.25% precisely) under a scenario set that incorporates supply constraints, tariff impacts and rising design‑in requirements. Under our central case the market reaches approximately USD 984.0 Million in 2026 and expands toward USD 1,296.2 Million by 2032.
Flip Flop IC Market
What these totals imply for 2026 decision cycles
- Capital allocation should plan for sustained incremental demand rather than explosive expansion—investments focused on resilience and qualification will yield higher IRR than opportunistic capacity builds.
- Procurement teams must price for moderate but persistent demand growth while factoring in localized regulatory shocks and shifting logistics costs.
- R&D and product managers should prioritize design‑in criteria that shorten qualification cycles, because near‑term growth is driven more by adoption in regulated and long‑lifecycle markets than by volume swings alone.
2026 macro drivers and headwinds
Three structural forces are shaping the market today and through 2026:
- Manufacturing and material expansion—global silicon wafer shipments show notable acceleration (e.g., a 13.1% increase year‑on‑year in Q1 2026), which lifts upstream capacity but also introduces timing mismatches for specific process nodes.
- Trade and compliance friction—the imposition of a 25% tariff on certain advanced logic semiconductors (effective Jan 15, 2026) and continuing export controls are increasing the geographic risk premium for suppliers and buyers alike.
- Lead‑time volatility—extended lead times for logic and memory components persist following the supply‑chain tightening observed in late 2025, compelling OEMs to de‑risk through multi‑sourcing and strategic stocking.
Strategic imperative
In 2026 the urgency is not just growth capture; it is risked growth capture. Firms that rebalance investment toward compliance‑ready manufacturing, design‑in robustness and supply‑chain transparency are positioned to convert modest market growth into outsized commercial returns.
How PW Consulting’s Flip‑Flop IC report delivers operational value
The full PW Consulting report is built to move teams from insight to action. It contains a modular toolkit that addresses the practical pain points most companies face in 2026 without broadcasting the proprietary numeric slices here.
- Supply‑chain topology and tier mapping — an operational view of who supplies front‑end wafers, who performs backend packaging and where single‑sourced choke points exist.
- BOM decomposition logic — standardized rules for breaking a module into candidate flip‑flop SKUs, mapping alternates and quantifying substitution risk for cost modeling.
- Yield and margin adjustment models — parametric models that let procurement and operations stress test yields, scrap rates and rework policies under different node and packaging scenarios.
- Technology roadmaps — a consolidated timeline of process node shifts, packaging innovations and speed‑grade introductions that affect design‑in windows and qualification lead times.
Each tool is accompanied by a practical playbook that shows how to use the outputs to negotiate supplier contracts, set safety stock policies and prioritize qualification workstreams. We deliberately withhold the report’s segmented tables in this briefing to protect its commercial integrity; however, we expose the analytical paths so teams can judge applicability quickly.
Competitive landscape — dimensions that determine 2026 design wins
The market structure shows moderate concentration: the top three suppliers represent a material share of addressable demand while the top five consolidate the majority of the qualified SKUs. This concentration profile informs how design wins and supply continuity play out in 2026.
Across the incumbent supplier set—firms such as Texas Instruments, onsemi, Nexperia, STMicroelectronics, Renesas and Analog Devices—the primary competitive dimensions we track are:
- Product breadth and qualification depth: portfolios that combine general‑purpose logic with automotive and industrial qualifications reduce customers’ integration and compliance overhead.
- Manufacturing footprint and capacity control: ownership or long‑term agreements on backend packaging and test lines reduce lead‑time exposure in a tariffed landscape.
- IP and performance differentiation: high‑speed and radiation‑hardened variants create defensible positions in niche end markets with higher margins.
- Channel and service ecosystem: distributors, design tool integrations and application engineering resources materially affect time‑to‑market for new modules.
Examples of observable market movement include datasheet and qualification updates across incumbents—product refreshes and compliance documentation are now common, reflecting suppliers’ emphasis on shorten qualification cycles and broadening addressable use cases. Such updates are signals that design teams use to prioritize partners, but the full set of strategic indicators and vendor scorecards is available in the PW Consulting report.
Design‑win playbook (high level)
- Prioritize suppliers that combine qualification depth with regional build options to mitigate tariff and export‑control exposure.
- Use BOM decomposition outputs to identify SKU consolidation opportunities that simplify long‑term support and obsolescence management.
- Embed functional‑safety and lifecycle clauses into procurement contracts to align incentives for long‑lived automotive and industrial programs.
Operational use cases — how our models resolve 2026 pain points
Teams tell us the top execution problems in 2026 are: unpredictable supply windows, rising compliance costs and higher qualification burdens. The PW Consulting toolkit tackles those issues by enabling:
- Rapid substitution analysis—identify candidate alternates and quantify requalification effort without manual teardown for each BOM change.
- Cost impact simulations—translate yield shifts and tariff scenarios into P&L outcomes at the SKU level.
- Compliance pathing—map what is required to meet regional regulatory and ESG thresholds and estimate the calendar and cost delta for each path.
Those capabilities are designed to be operational: procurement teams can produce negotiation‑ready impact statements, and R&D teams get prioritized lists for lifecycle extension and product consolidation.
Methodology — why our numbers are decision‑grade
PW Consulting applies a layered triangulation methodology to ensure the report’s outputs meet the evidentiary standards CFOs expect. Key pillars include:
- Patent and datasheet mapping to build a product‑feature matrix that is reconciled against shipment and customs flows.
- Proprietary BOM teardowns and long‑form supplier interviews to validate nominal BOM logic and alternate part performance.
- Quantitative calibration using public shipment statistics, manufacturer disclosures and third‑party supply‑chain datasets to harmonize market totals and growth trajectories.
We expressly combine open sources with non‑public, consented inputs from industry participants—structured interviews, supplier scorecards and anonymized procurement data—so that the report surfaces causal relationships rather than merely correlational trends. The full methodology appendix documents sample sizes, interview protocols and the triangulation rules used to reconcile divergent inputs.
Call to action
For teams allocating 2026 capex or restructuring supply chains, this report converts uncertainty into executable options. To review the complete regional and application breakouts, vendor scorecards and the downloadable operational toolset, access the full report: Access the full report.
Final guidance for 2026
In 2026 the strategic frame is clear: the market growth is steady, but regulatory and supply‑chain volatility amplifies downside risk. The highest‑impact moves are not necessarily capacity expansion but decisions that shorten qualification cycles, diversify supply in tariff‑sensitive corridors, and simplify BOMs to reduce logistical friction. PW Consulting’s Flip‑Flop IC market toolkit is specifically designed to translate those moves into measurable P&L outcomes while preserving strategic optionality. For executives who prefer a data‑driven operations playbook rather than raw tables, the full report provides the necessary granular inputs and executable templates.
For detailed analysis on this topic, please visit the official page:
Flip Flop IC Market
Lacy Lee
Senior Marketing Manager
sales@pmarketresearch.com
00852-95632430
PW Consulting: www.pmarketresearch.com
Latest Post